


美国联邦地质调查局(USGS)上有一份关于全美2005年取用水情况的报告(http://pubs.usgs.gov/circ/1344/pdf/c1344.pdf),对我们了解美国水资源状况有一个总的了解,博主选取其中的摘要部分和热力发电部分进行了翻译,未获授权翻译,也未进行校对。本人承诺不应用于商业用途。
Abstract
摘要

表1 1950-2005年全美用水量趋势(单位:十亿加仑/天)
Estimates of water use in the United States indicate that about 410 billion gallons per day (Bgal/d) were withdrawn in 2005 for all categories summarized in this report. This total is slightly less than the estimate for 2000, and about 5 percent less than total withdrawals in the peak year of 1980. Freshwater withdrawals in 2005 were 349 Bgal/d, or 85 percent of the total freshwater and saline-water withdrawals. Fresh groundwater withdrawals of 79.6 Bgal/day in 2005 were about 5 percent less than in 2000, and fresh surface-water withdrawals of 270 Bgal/day were about the same as in 2000. Withdrawals for thermoelectric-power generation and irrigation, the two largest uses of water, have stabilized or decreased since 1980. Withdrawals for public-supply and domestic uses have increased steadily since estimates began.
Estimates of water use in the United States indicate that about 410 billion gallons per day (Bgal/d) were withdrawn in 2005 for all categories summarized in this report. This total is slightly less than the estimate for 2000, and about 5 percent less than total withdrawals in the peak year of 1980. Freshwater withdrawals in 2005 were 349 Bgal/d, or 85 percent of the total freshwater and saline-water withdrawals. Fresh groundwater withdrawals of 79.6 Bgal/day in 2005 were about 5 percent less than in 2000, and fresh surface-water withdrawals of 270 Bgal/day were about the same as in 2000. Withdrawals for thermoelectric-power generation and irrigation, the two largest uses of water, have stabilized or decreased since 1980. Withdrawals for public-supply and domestic uses have increased steadily since estimates began.
美国用水预测表明,本报告所列全美2005年所有取水约4100亿加仑/天(410Bgal/d),略低于2000年估计数,比1980年高峰年总取水略少约5%。2005年淡水取水约349Bgal/d,或占淡水和咸水取水总量的85%。2005年地下淡水取水量为 79.6 Bgal/d,比2000年约少5%,同时地表淡水取水量约270 Bgal/d,约等于2000年。热力发电和灌溉用水取水是最大的两类用水领域,1980年以来已趋于稳定或下降。公共供水和家庭用水自开始估算以来已经开始稳步增长。
Thermoelectric-power generation water withdrawals were an estimated 201 Bgal/d in 2005, about 3 percent more than in 2000. In 2005, thermoelectric freshwater withdrawals accounted for 41 percent of all freshwater withdrawals. Nearly all of the water withdrawn for thermoelectric power was surface water used for once-through cooling at power plants. Twenty-nine percent of thermoelectric-power withdrawals were saline water from oceans and brackish coastal water bodies.
2005年热力发电用水预计为201Bgal/d,比2000年增长3%。2005年热力发电淡水取水量占全部淡水取水量的41%。几乎所有热力发电的取水都是用于电厂开式循环冷却的地表水。29%的热力发电取水来自从海洋和沿海水域取用的盐水。
Withdrawals for irrigation in 2005 were 128 Bgal/d, about 8 percent less than in 2000 and approximately equal to estimates of irrigation water use in 1970. In 2005, irrigation withdrawals accounted for 37 percent of all freshwater withdrawals and 62 percent of all freshwater withdrawals excluding thermoelectric withdrawals. Irrigated acreage increased from 25 million acres in 1950 to 58 million acres in 1980, then remained fairly constant before increasing in 2000 and 2005 to more than 60 million acres. The number of acres irrigated using sprinkler and microirrigation systems
has continued to increase and in 2005 accounted for 56 percent of the total irrigated acreage.
2005年灌溉用取水约128Bgal/d,相比2000年低约8%而约相当于1970年的灌溉取水量。2005年,灌溉取水量约占全部淡水取水量的37%以及非热力发电用淡水的62%。灌溉量从1950年的2500万英亩增长到1980年的5800万英亩,而后基本稳定到2000年,2005年预计将超过6000万英亩。采用喷灌和微灌技术灌溉的农田持续增长,2005年预计将占到全部灌溉土地的56%。
Water withdrawals for public supply were 44.2 Bgal/d in 2005, which is 2 percent more than in 2000, although the population increased by more than 5 percent during that time. Public supply accounted for 13 percent of all freshwater withdrawals in 2005 and 21 percent of all freshwater withdrawals excluding thermoelectric withdrawals. The percentage of the U.S. population obtaining drinking water from public suppliers has increased steadily from 62 percent in 1950 to 86 percent in 2005. Most of the population providing their own household water obtained their supplies from ground-water sources.
2005年公共供水取水预计为44.2Bgal/d,比2000年增长2%,但同期(供应)人口增长超过5%。2005年公共淡水取水量占全部淡水取水量的13%以及非热力发电用淡水的21%。全美通过公共供水系统获得饮用水的人口已从1950年的62%稳步增长到2005年的86%。采用家庭自供水人口大部分通过地下水源获得供水。
Self-supplied industrial water withdrawals continued to decline in 2005, as they have since their peak in 1970. Self-supplied industrial withdrawals were an estimated 18.2 Bgal/d in 2005, a 30-percent decrease from 1985. An estimated 4.02 Bgal/d were withdrawn for mining in 2005, which is 11 percent less than in 2000, and 18 percent less than in 1990. Withdrawals for mining were only 58 percent freshwater.
从1970年达到高峰后,自供水工业取水量2005年内继续下降。2005年自供工业取水量预计为18.2Bgal/d,相比1985年下降30%。2005年预计有4.02Bgal/d的取水用于采矿业,相比2000年下降约11%、相比1990年下降约18%。采矿业取水中只有58%是淡水。
Livestock water use was estimated to be 2.14 Bgal/d in 2005, which is the smallest estimate since 1975, possibly due to the use of standardized coefficients for estimation of animal water needs. Water use for aquaculture was an estimated 8.78 Bgal/d in 2005, nearly four times the amount estimated in 1985. Part of this increase is due to the inclusion of more facilities in the estimates in 2005, and the use of standardized coefficients for estimating aquaculture use from other data.
2005年牲畜用水预计为2.14Bgal/d,是1975年以来最小量了,这可能是由于在动物需水量方面采取了标准化系数的原因。2005年水产养殖用水量预计为8.78Bgal/d,约为1985年的4倍,这种增长的部分原因是由于2005年有更多的设施纳入技术并且在从其他数据预测水产养殖用水方面采取了标准化系数。
Fresh surface water was the source for a majority of the public-supply, irrigation, aquaculture, thermoelectric, and industrial withdrawals. Nearly 30 percent of all fresh surface-water withdrawals in 2005 occurred in five States. In California, Idaho, and Colorado, most of the fresh surface-water withdrawals were for irrigation. In Texas and Illinois, most of the fresh surface-water withdrawals were for thermoelectric power generation.
地表淡水是公共供水、灌溉、水产养殖、热力发电和工业取水的主要来源。2005年有5个州地表水取水率超过30%。加利福尼亚州、爱达荷州、科罗拉多州,地表淡水中大部分用于灌溉。德克萨斯州和伊利诺伊州的地表淡水取水大部分用于热力发电。
About 67 percent of fresh groundwater withdrawals in 2005 were for irrigation, and 18 percent were for public supply. More than half of fresh groundwater withdrawals in the United States in 2005 occurred in six States. In California, Texas, Nebraska, Arkansas, and Idaho, most of the fresh groundwater withdrawals were for irrigation. In Florida, 52 percent of all fresh groundwater withdrawals were for public supply, and 34 percent were for irrigation.
2005年大约67%的地下淡水用于灌溉、18%用于公共供水。2005年全美有6个州地下淡水取水率超过50%。在加利福尼亚州、德克萨斯州、内布拉斯加州、阿肯色州和爱达荷州,地下淡水中的大部分用于灌溉;在佛罗里达州,52%的地下淡水用于公共供水、34%的地下淡水用于灌溉。
(Thermoelectric Power 热力发电)
Thermoelectric power has been the category with the largest water withdrawals since 1965, and for 2005 made up 49 percent of total withdrawals. The largest total and fresh and saline surface-water withdrawals were during 1980. Withdrawals by thermoelectric-power plants increased from 40 Bgal/d in 1950 to 210 Bgal/d in 1980, declined to 187 Bgal/d in 1985, and have since increased to 201 Bgal/d in 2005.
自1965年起,热力发电就成为最大的取水用户,2005年达到了总取水量的49%以上。1980年(取水)总量、淡水和咸水等达到最大。热力发电厂取水量从1950年的40Bgal/d上升到210Bgal/d,1985年下降至187Bgal/d,之后回升至2005年的201Bgal/d。
Thermoelectric-power water withdrawals have been affected by limited water availability in some areas of the United States, and also by sections of the Clean Water Act (Amendments to the 1972 Federal Water Pollution Control Act) that regulate cooling system thermal discharges and mandate the use of best available technology for minimizing environmental effects of cooling water intakes (Michelletti and Burns, 2002). Consequently, since the 1970s, power plants have increasingly been built with or converted to using wet recirculating cooling systems (using cooling towers or cooling ponds) or dry recirculating (air-cooled) systems instead of using once-through cooling systems. Recent energy industry data indicate that about 43 percent of the generating capacity in the United States is associated with once-through cooling, 42 percent with wet recirculating cooling towers, 14 percent with wet recirculating cooling ponds, and less than 1 percent with dry recirculating systems (Feeley and others, 2008). Records of cooling systems in fossil fuel plants from 1996 to 2004 and a smaller number of nuclear plants from 1996 to 2000 indicate that average use rates for once-through systems ranged between 50 gallons per kilowatt hour (gal/kWh) and 65 gal/kWh; for recirculating-cooling systems with cooling towers, between 1.0 gal/kWh to 2.0 gal/kWh; and for recirculating-cooling systems with ponds or canals, between 14 gal/kWh to 24 gal/kWh. However, consumptive use ranged from a small percentage of total withdrawals at once-through power plants to approximately 70 percent of water withdrawn at recirculation systems with cooling towers (Dziegielewski and others, 2006).
热力发电取水在美国的一些地区受到可用水资源有限和《清洁水法》(1972年《联邦水污染控制法》修正案)的影响,该法要求冷却系统的热排放和强制要求使用可能的最好技术以使得冷却水进水口的环境影响最小化(米切莱蒂和布尔萨,2002年)。因此,自上世纪70年代以来,电厂已越来越多地在建造时直接采用或(运行电站)转向采用湿式循环冷却系统(使用冷却塔或冷却水池)或干循环(风冷)系统来而不是使用直流冷却系统。最近的能源行业数据表明,全美大约43%的发电装机采用直流冷却(开式循环冷却),42%的采用湿式循环冷却塔,14%采用湿式循环冷却池,采用干式循环系统的不足1%(菲利等人,2008年)。一项关于从1996年到2004年的化石燃料电厂以及1996年到2000年少量核电厂的冷却水系统的记录表明,直流系统的平均用水量为50-65加仑每千瓦小时(gal/KW.h);采用冷却塔的循环冷却系统,(平均用水量)在1-2加仑/千瓦时,采用水池或水渠的循环冷却系统,(平均用水量)在14-24加仑/千瓦时之间。然而,直流循环发电厂总用水量的消耗量大约只有采取冷却塔的循环冷却水系统取水量(消耗)的70%(Dziegielewski等人,2006)。
Use of recirculation water for cooling reduces the intake water requirement at a power plant, resulting in reduced water withdrawals. The increasing influence over time of using technologies that require less water can be observed in the USGS water-use historical record. The trend showing the increase, decline, and subsequent gradual increase of water withdrawals for thermoelectric power generation from 1950 to 2005 (table 14) occurred as the net power generated increased steadily during the same period (U.S. Department of Energy, 2007). The ratio of total water withdrawals to energy produced, in gallons per kilowatt hour, can be calculated using the USGS estimate of thermoelectric water use with the USDOE EIA records of historic net power production. This ratio decreased from an average of 63 gal/kWh during 1950 to 23 gal/kWh during 2005.
发电厂冷却水的循环使用减少了进水要求,从而减少了取水量。采取需水量更少的技术带来日益增加的影响在联邦地质调查局(USGS)的用水记录中可以看到。趋势显示出热力发电取水量增长、下降,从1950年到2005年由于净发电装机的同期持续增长导致的逐渐增加(美国能源部,2007年)。用于能量生产的取水总量比例,加仑每千瓦小时,可以使用美国联邦地质调查局(USGS)的热力发电用水估计来计算美国能源部能源信息统计署历史净发电记录所需(用水)。这一比率1950年的63加仑/千瓦时均值下降到2005年的23加仑/千瓦时。

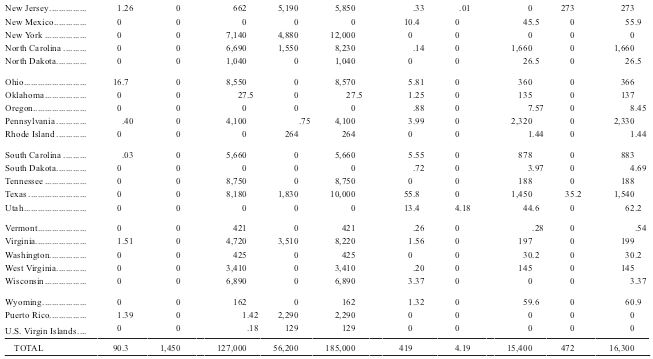
表2 2005年全美热力发电取水量分类统计表(单位,百万加仑/天)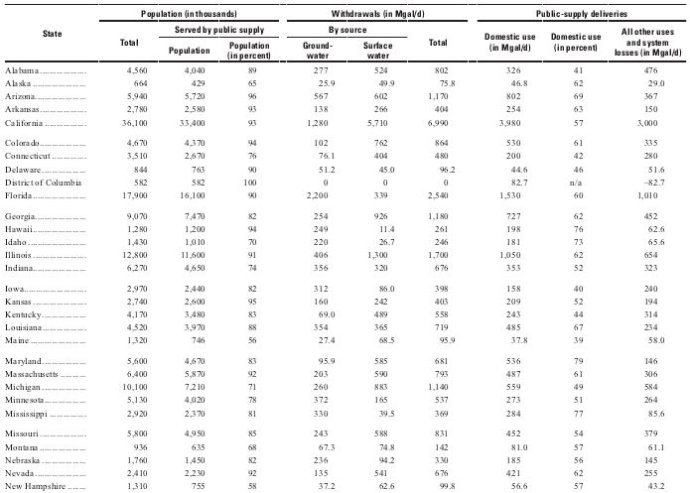
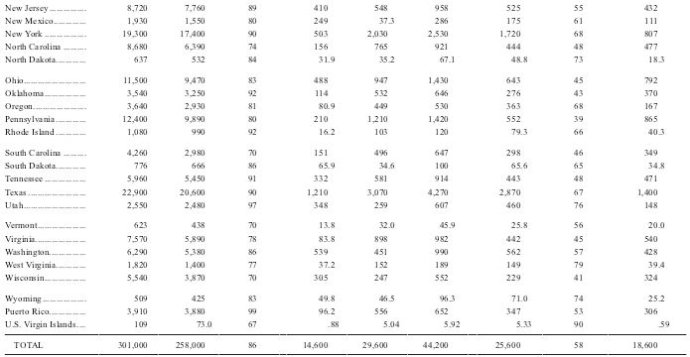
表3 2005年全美公共供水取水量(单位,百万加仑/天)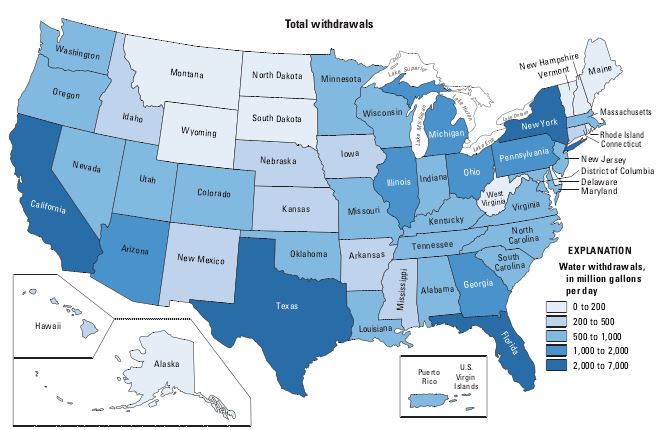
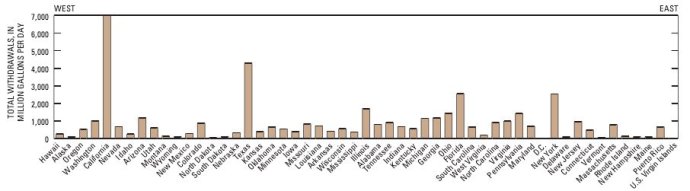
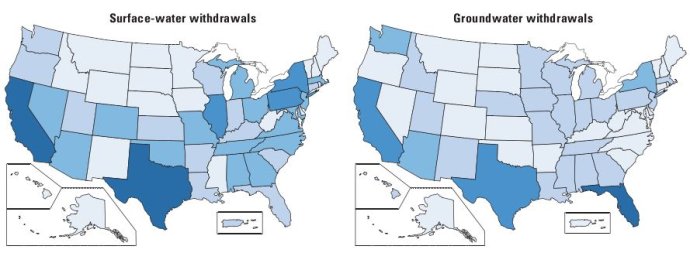
图12005年全美公共取水地图(分水源和分州)
博主译注:
1、从该报告可以看到美国1950年到2005年期间用水变化趋势,尤其是热力发电用水的趋势,尽管节水技术有了显著进步,但因热力发电总量的增加,热力发电用水总量还是增加较快,占到了全美用水的半壁江山。
2、与以往听一些水利专家介绍的情况不同的是,公共供水系统供应了全美86%人口(约2.58亿)的家庭用水;公共供水系统中的2/3来自于地表水(如湖和径流),其余1/3来自于地下水,有38个州依靠地表水供应50%以上的家庭用水。因此研究这些公共供水系统取水点与核电站取排水点的关系、核电站下游公共取水点应急保障措施等对于我们理解美国的有关法律法规将是有帮助的,建议国内业界和水资源、环境保护主管部门关注。
地址:北京市西城区南礼士路21号六层 电话:010-56971705 ; 传真:010-56971700
邮箱:cnea@org-cnea.cn 京ICP备16008721号-2
您是访问本站的第位嘉宾

 官网手机端
官网手机端

 微信公众号
微信公众号

 核能云端
核能云端博物馆微博